- DATE:
- AUTHOR:
- The OfficeRnD Team
- RELATED ROADMAP ITEMS:
- [Admin Experience] Introduce a new Admin homepage
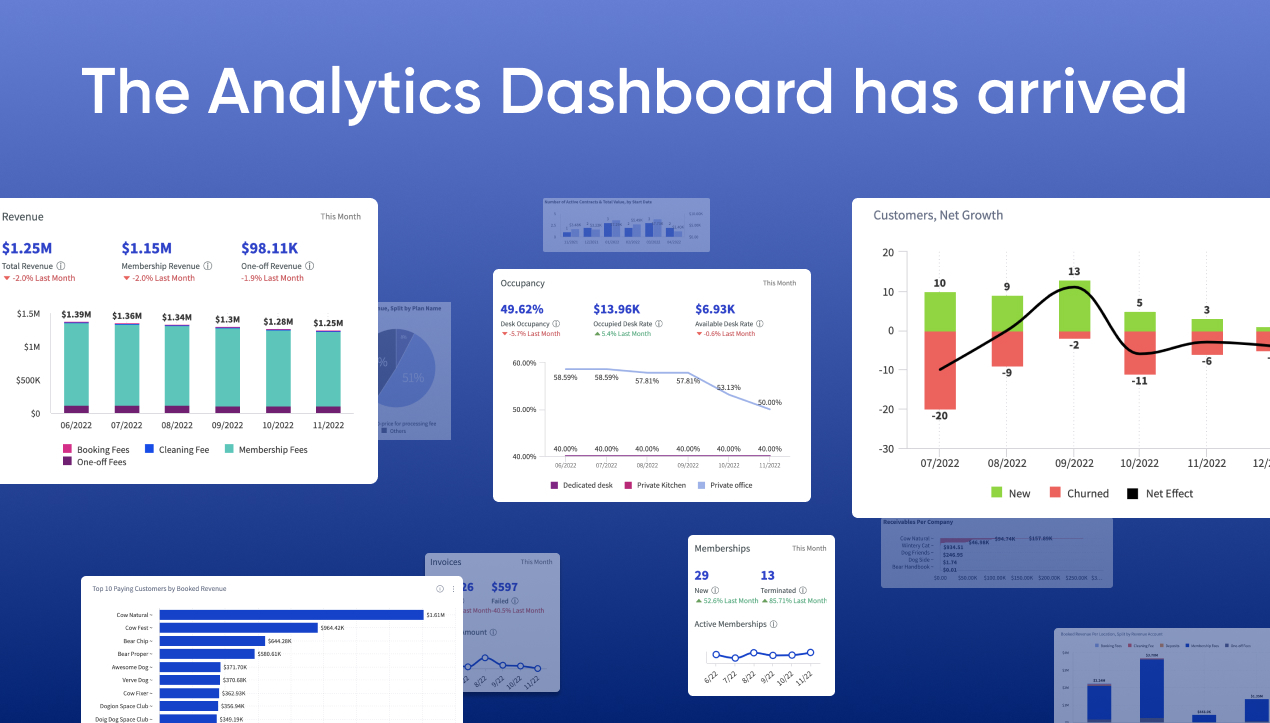
Unlock Workplace Insights with the Analytics Dashboard 📊
We rolled out the new Analytics Dashboard in beta earlier this year and are excited to announce the full release to all organizations! Our workplace reporting suite Analytics has been refined with a new, clean interface that lets you access the most important workplace KPIs right at your fingertips.
A Revamped Analytics Home Dashboard 
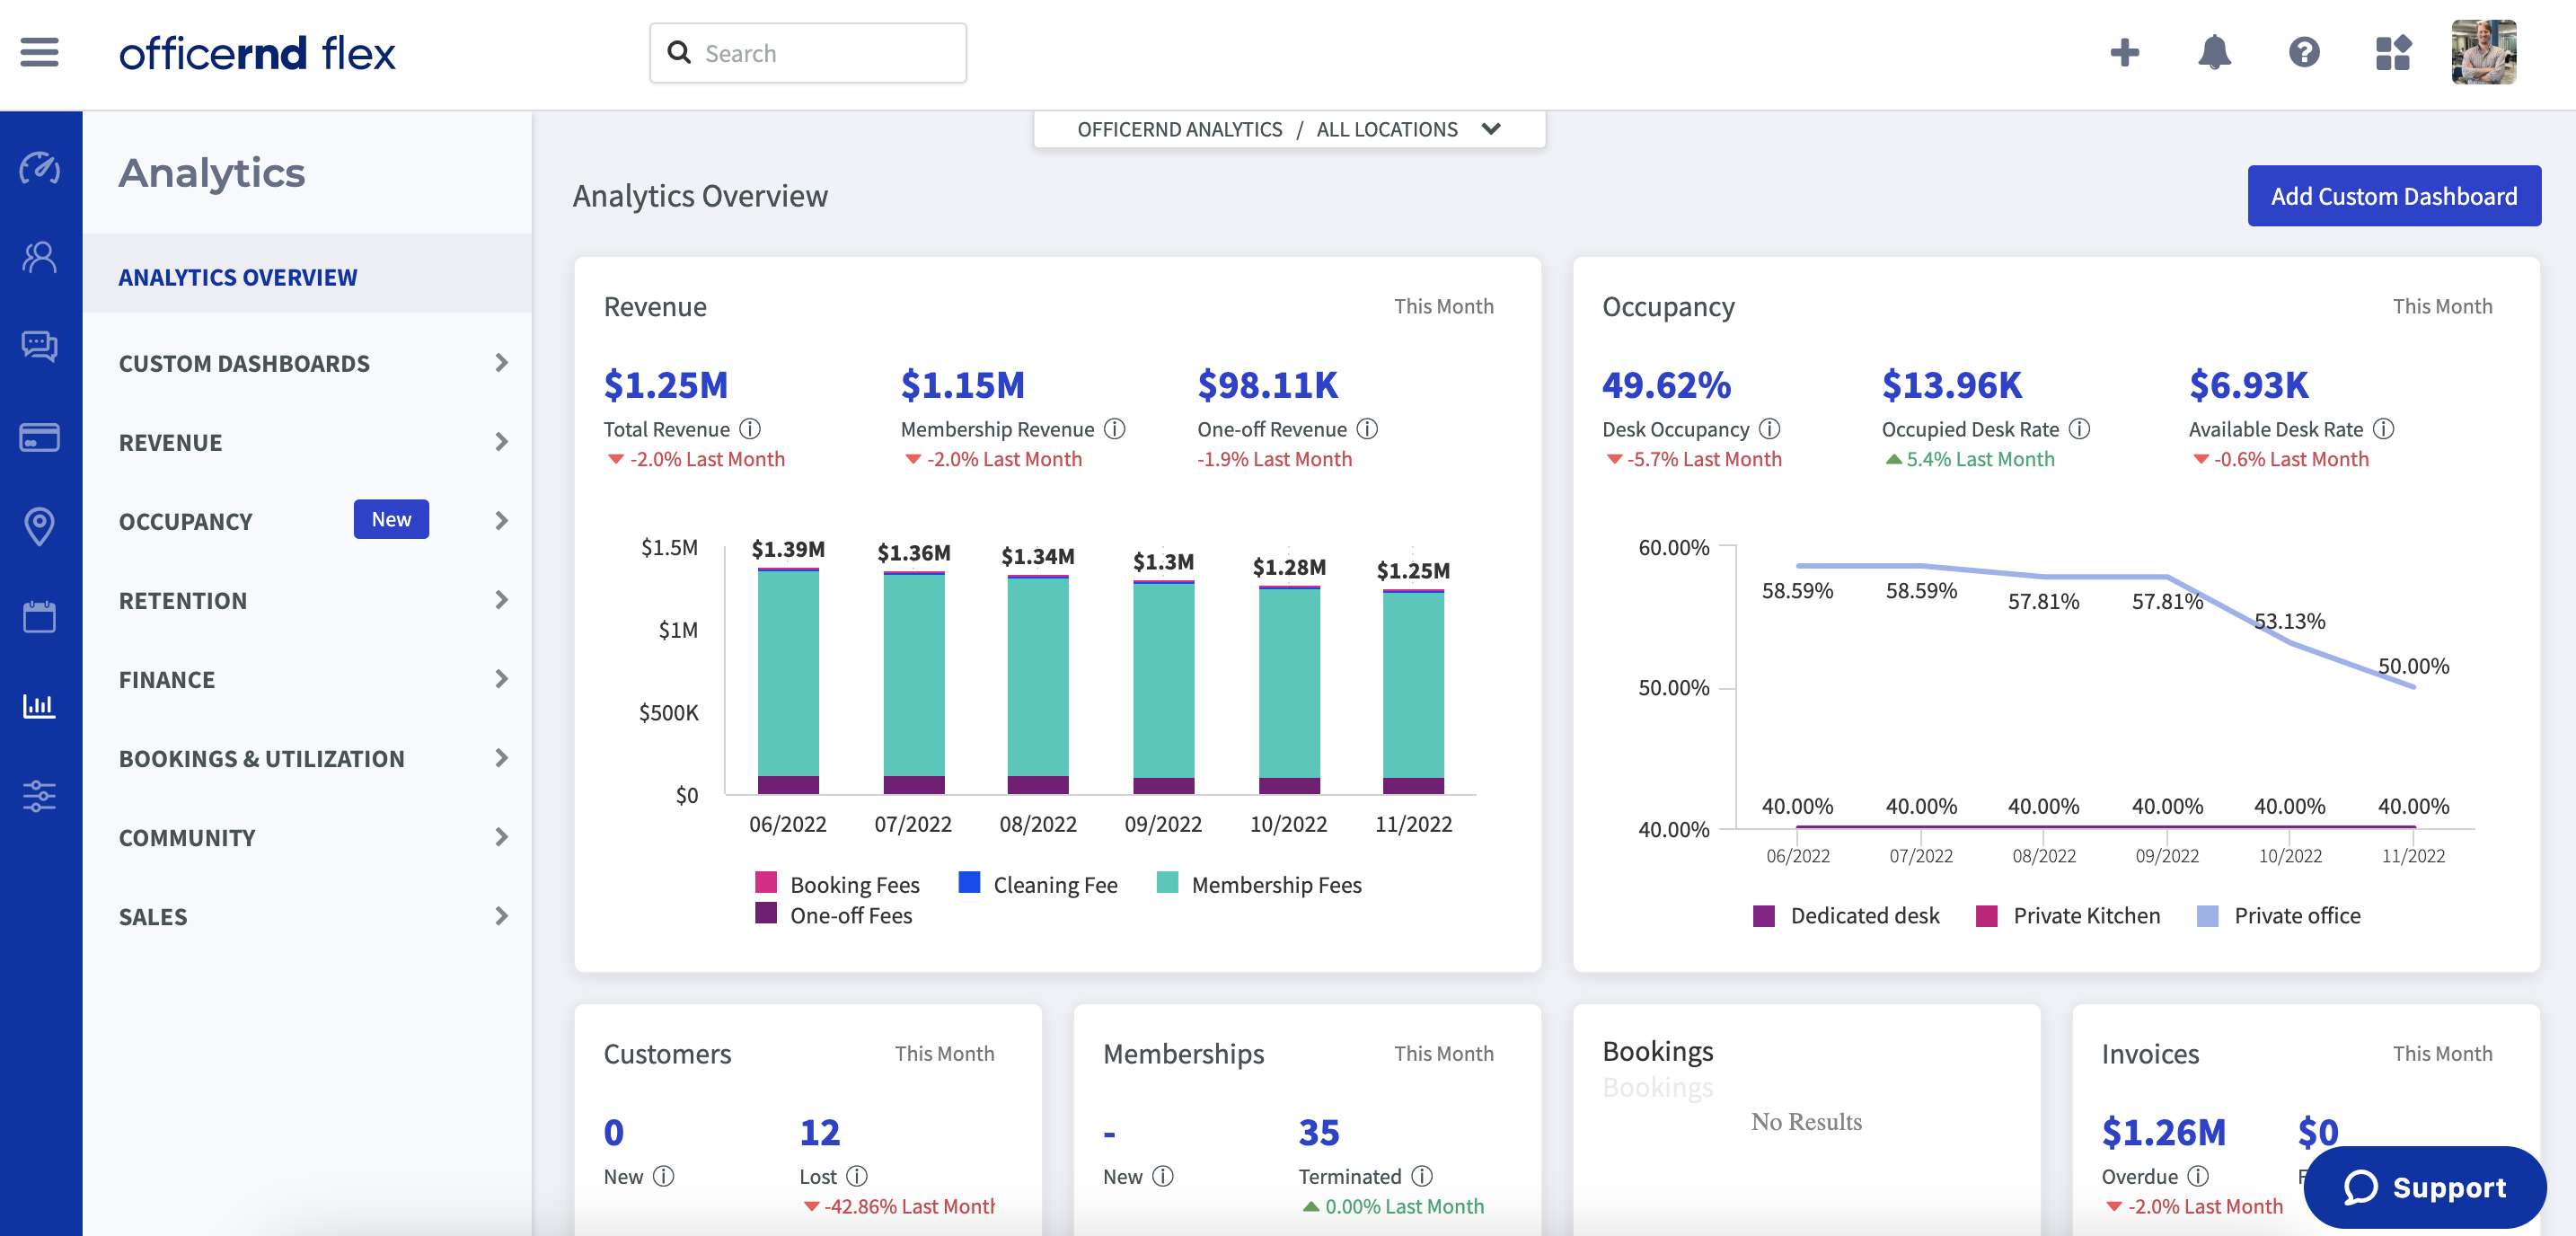
The new reporting experience starts with the Analytics home dashboard - a redesigned tool built to surface the most important workplace data without needing to dig into reports. Revenue and Occupancy are front and center, allowing you to easily track the revenue performance of your space and drill down into occupancy metrics for your resources.
Operators can still click directly on certain charts and graphs to drill into dashboard data and move to the desired information. From the new home dashboard operators also have access to data on Customers, Memberships, Bookings, and Invoices. For a better breakdown of each widget hover over the "i" for a more detailed description.
Access and Browse Reports with Ease 
We’re retiring the “Reports” page that was located next to the “Analytics” page. All dashboards and reports are now neatly arranged in an expandable navigation menu within Analytics. We have split up the workplace data into relevant categories so you can sort through them more easily and find the reports that are important in less time than before!
Custom Dashboards Now Available for All 
All customers now have access to our Custom Dashboards module that grants each user the ability to build their own dashboards, and have the ability keep them private or share them with their whole organization.
To access Custom Dashboards navigate to Analytics -> Custom Dashboards. We are excited to see the personalized dashboards operators will start building with this functionality!
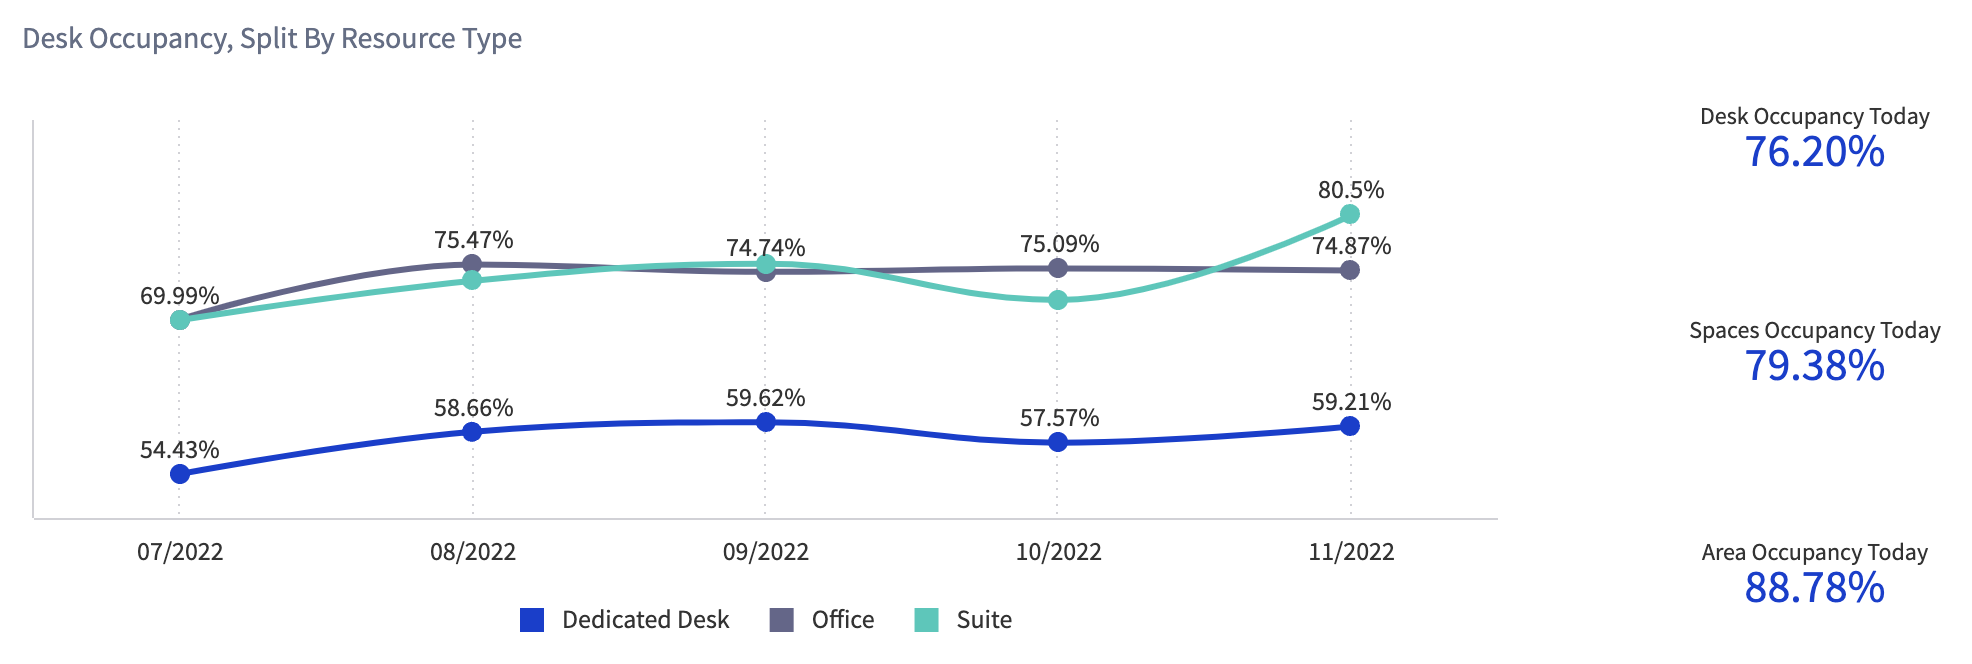
Improved Occupancy Reporting 
The team has completely revamped the Occupancy reports category to enable you to have a clear visual representation of key metrics and more control over the detailed reports required for deeper analysis.
We've revamped the "How We Calculate Occupancy" article in the help portal with a lot more detail, so you can use it as a reference when answering any questions related to Occupancy.
We're keeping the Occupancy Old report (renamed to Occupancy Legacy Report) and the Occupancy Interval report, so we can ensure a smoother transition to the new reports.
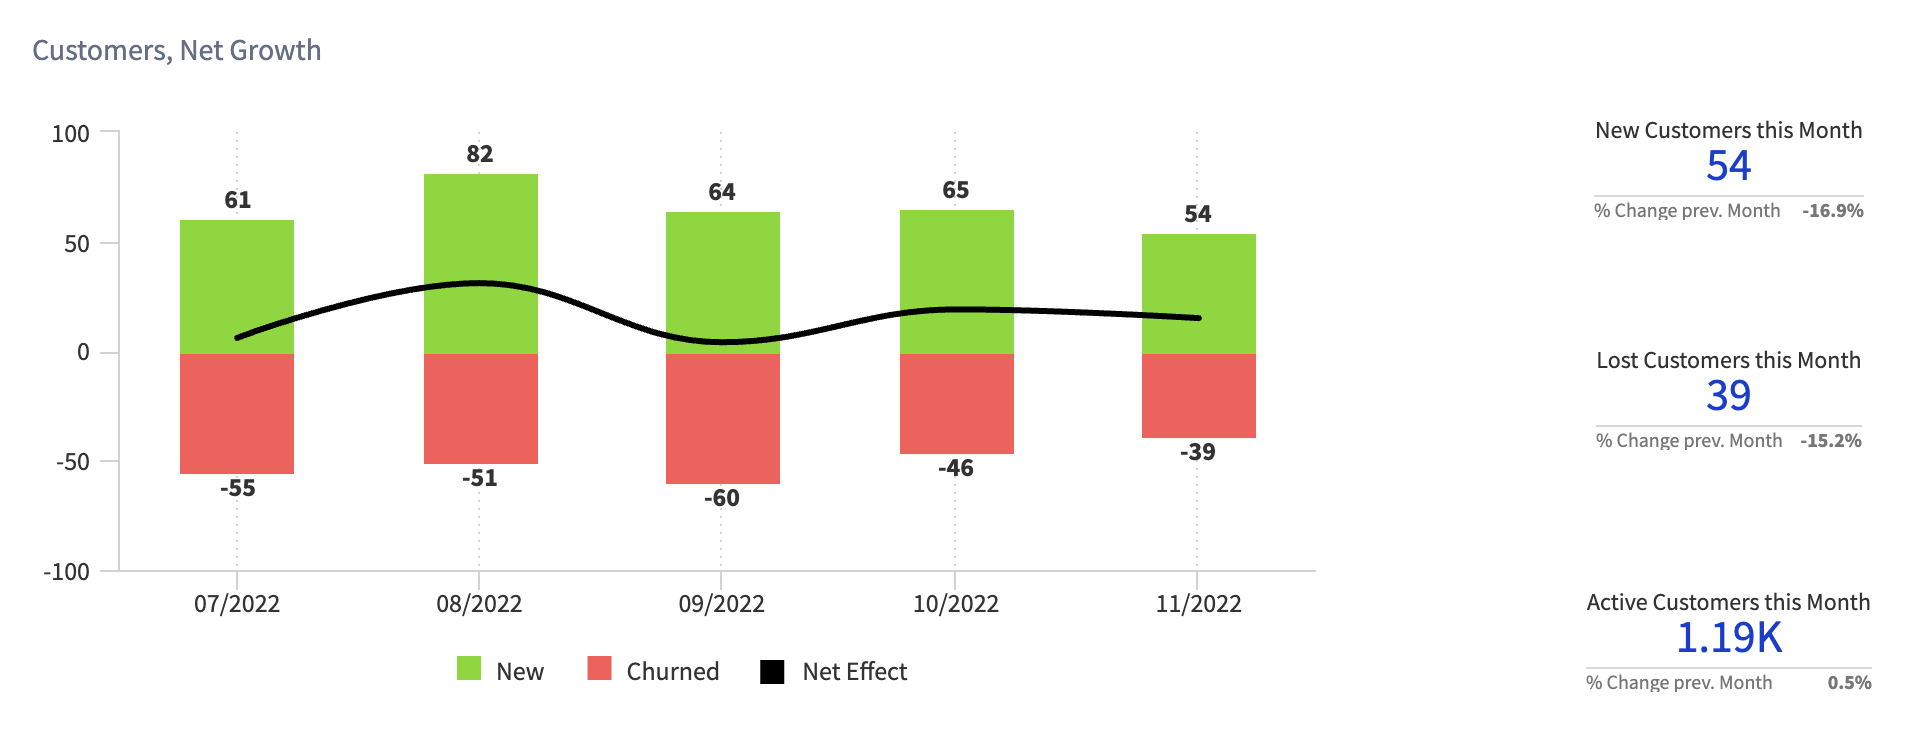
The Retention Dashboard 
We’re also introducing a brand new Retention Overview Dashboard inside Analytics. This dashboard will allow you to see how your space is retaining customers and revenue month-over-month, as well as keep track of key KPIs we haven’t been able to offer up until now, such as Avg. Customer LTV (Lifetime value) and Avg. Length of Stay. Link to the documentation article here.
We love your feedback 
As always, we are eager to hear how you feel about these new reporting updates!
Thoughts? Questions? Concerns? Complaints? Ideas for improvement? We love 'em all.