- DATE:
- AUTHOR:
- The OfficeRnD Team
- RELATED ROADMAP ITEMS:
- Improve the overall design of Analytics
The New Analytics Experience has Arrived 📊
We are excited to share that the revamped Analytics experience has arrived! Our workplace reporting suite Analytics has been refined with a new, clean interface that lets you access the most important workplace KPIs right at your fingertips. You can check out a video preview of the new Analytics functionality in our Q1 Product Update Webinar here!
We are planning to roll out the new Analytics experience to select organizations over the next couple of weeks and then will roll out this update to everyone. If you are interested in getting an early look email us at product@officernd.com to get started.
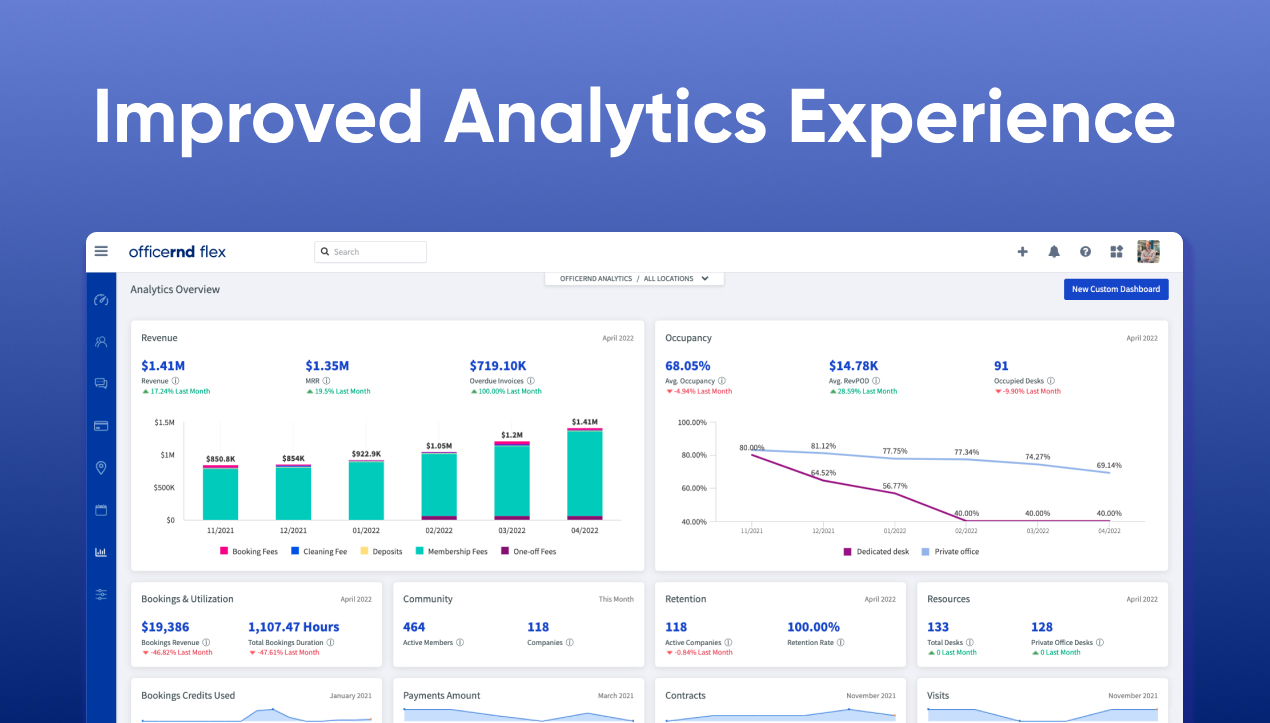
Unlock Insights with the new Analytics home dashboard 🏠
One of the biggest pieces of feedback we have received since we launched Analytics last year is that people loved the visual charts and graphs, but wanted a better way to access some of the pre-built reports we offer. Over the past couple of months, we have been working on some core improvements to the Analytics experience to expose more workplace statistics and make them even easier for operators to find.
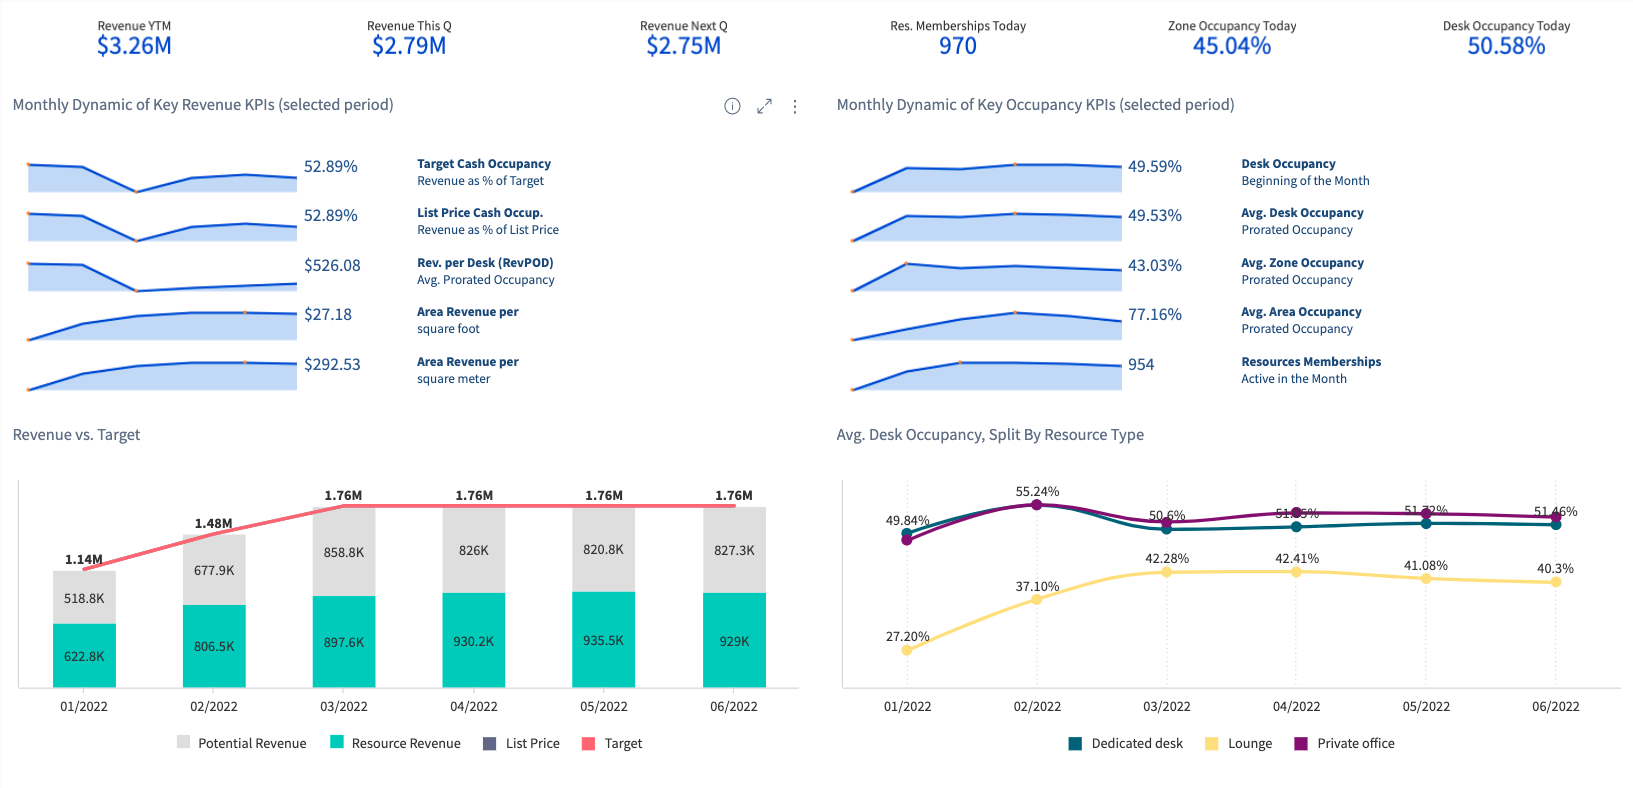
The new reporting experience starts with the Analytics home dashboard - a redesigned tool built to surface the most important workplace data without needing to dig into your reports. Revenue and Occupancy are front and center, allowing you to easily track the revenue performance of your space and drill down into occupancy metrics for your resources. Operators can still click directly on certain charts and graphs to drill into dashboard data and move to the desired information. From the new home dashboard operators also have access to Bookings & Utilization, Community, Retention, Resources, Credits, Payments, Contracts, and Visits.
Workplace Reporting Simplified 📊
With the latest update, we have simplified all platform reports into one unified Analytics section for easier navigation. This allows your team to see all of your relevant data in one place without jumping around in the platform. OfficeRnD Analytics is your one-stop shop to understand how your workplace is doing and gain new insights about your members.
To help better organize workplace data, we have also introduced a new sidebar that groups all space reports and dashboards into relevant sections for easier navigation. We have split up the workplace data into various categories so you can sort through it more easily, and find the reports that are important in less time than before!
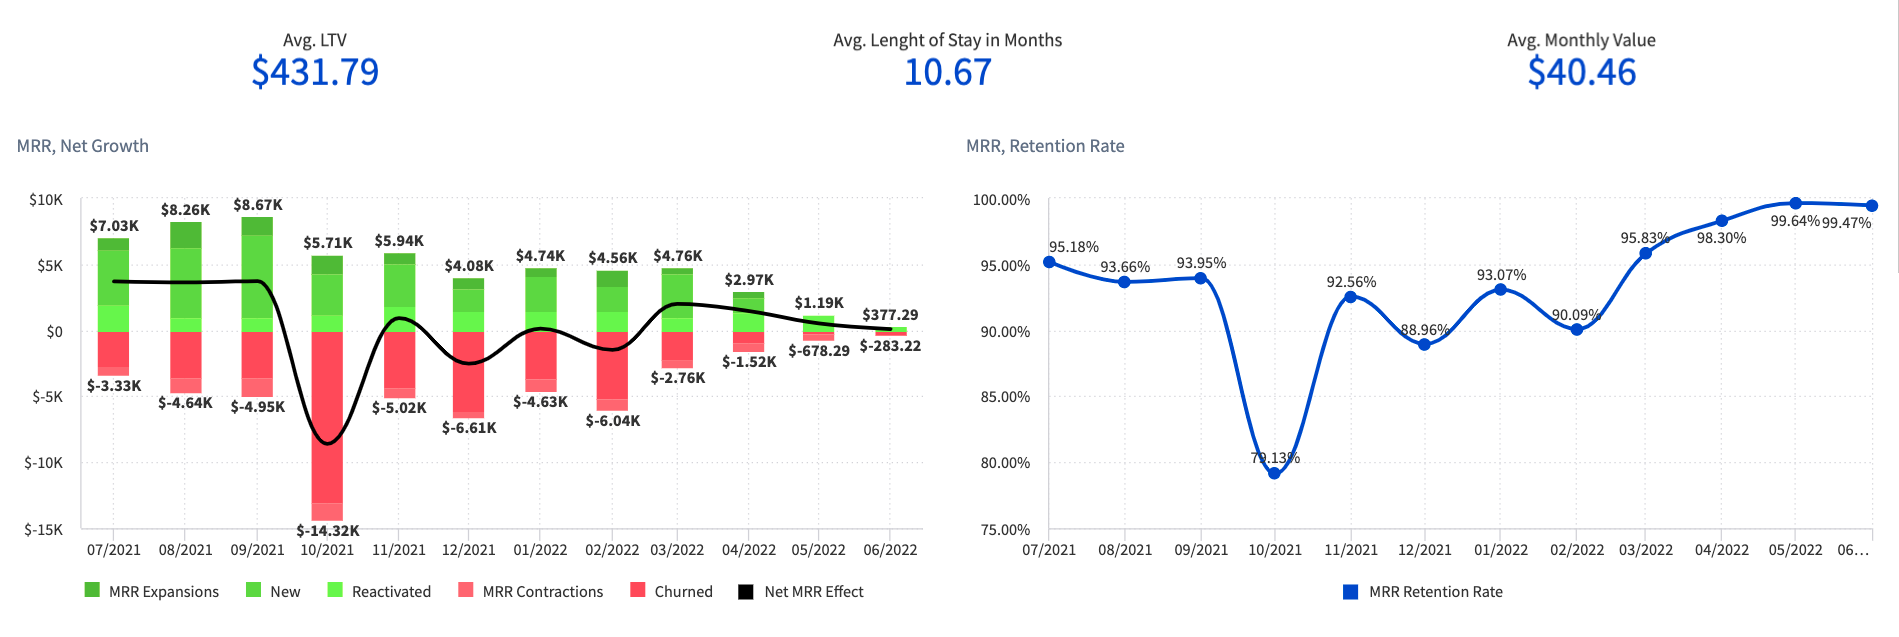
The Retention Dashboard 🙋♂️
The new Retention Dashboard is a powerful tool for understanding your customers. With data points like average lifetime value, length of stay, and monthly spend it's easy to see which strategies are most effective at retaining members as well as increasing revenue!
Improved Occupancy Reporting 🏢
With the new Occupancy reports, we are able to provide space owners with more in-depth insights into how their buildings are being used. We are giving admins more granular control of data here - so they can more easily see occupancy statistics of certain resources and locations.
Start using the new Analytics Experience today 🏁
We hope you are as excited about all the new changes to Analytics as we are. We will be rolling out the new Analytics experience in waves over the next couple of weeks to select organizations and then roll it out to everybody. If you are interested in getting an early look at the new Analytics experience, email us at product@officernd.com and we can enroll you today.
As always, we greatly value your feedback on anything we’ve shipped or are actively working on.
Thanks for reading, and have an amazing week! 🙌