- DATE:
- AUTHOR:
- The OfficeRnD Team
New in Data Hub: Benchmarking Metrics (Experimental)
 We are thrilled to announce a new, amazing dashboard in Flex Data Hub!
This is an experimental dashboard for the time being and we’d love for you to give it a spin and let us know how it fits into your workflow. Your feedback will help shape its next iteration – so please explore, play around, and share your thoughts!
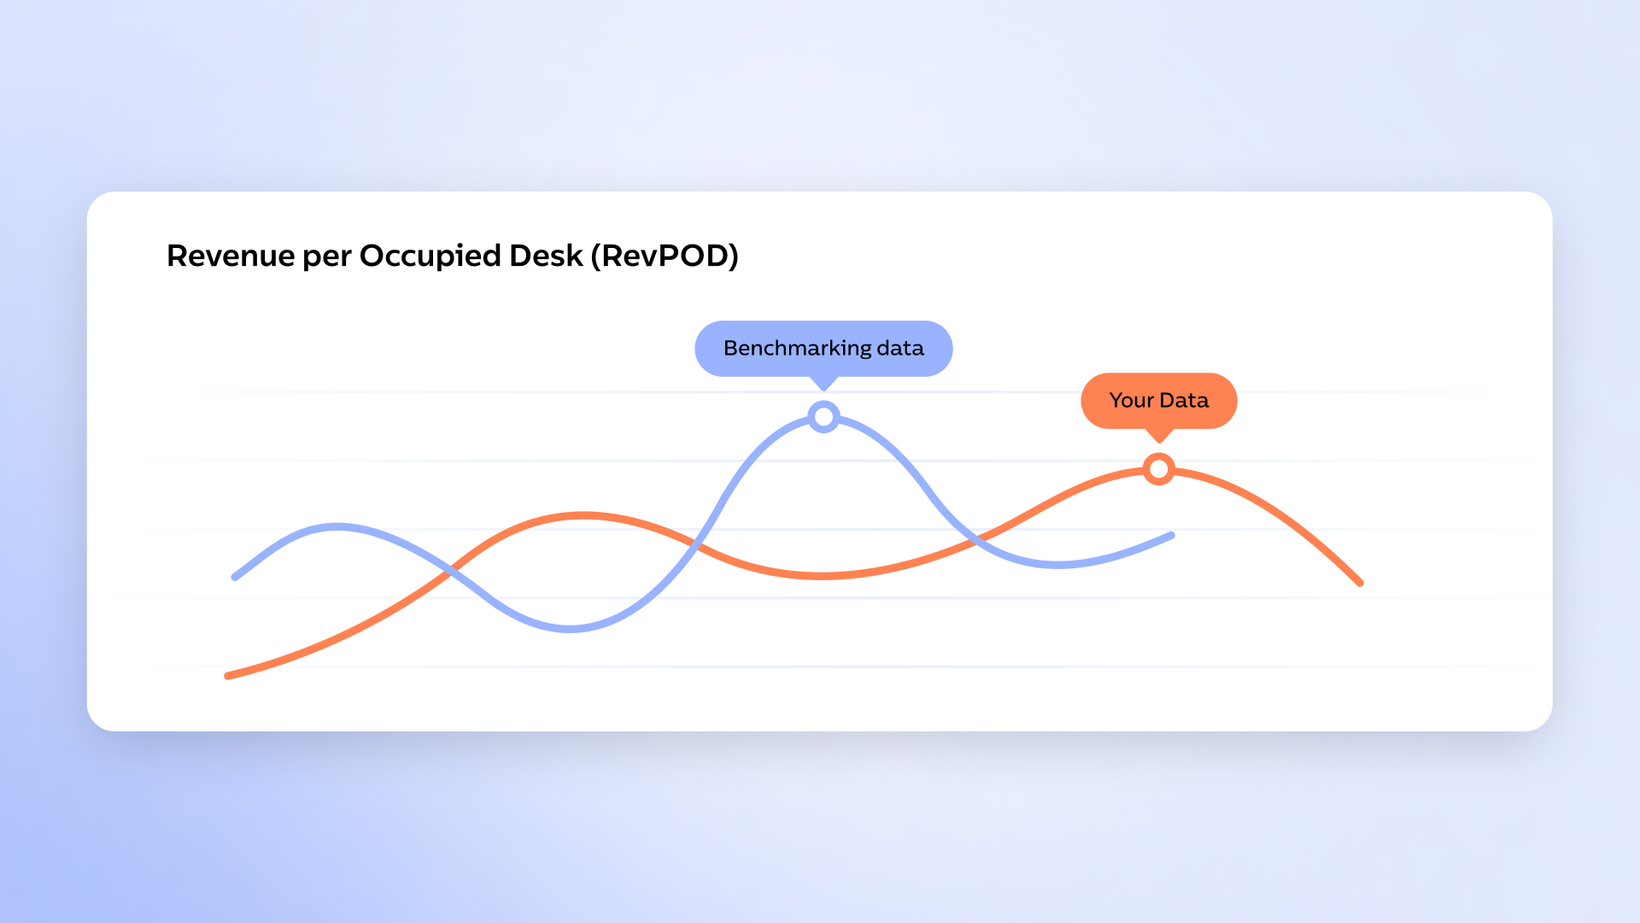
Benchmarking Metrics in Data Hub is a powerful new way to see how your performance compares to the flex space industry. No more guesswork — you can now measure your key KPIs against aggregated, anonymized data from peers in your region: all the insights, none of the spreadsheets.
With Benchmarking Metrics, you can:
 Spot strengths and uncover growth opportunities
 Identify where you stand out (or where to fine-tune)
 Compare by country or state, with data in your local currency
 Make smarter, data-driven decisions that set your space apart
Track 6 key metrics – including revenue per desk, occupancy rates, and average booking price – and visualize trends with clear charts, benchmarks, and monthly comparisons. It’s available now for Flex customers in the US, UK, Canada, and Australia.
Keep in mind that this dashboard is still experimental, and you might see more changes coming over the next weeks and months.
Ready to see how you measure up? Learn more in our help article →